Monitoring inlets uplink
Inlets Uplink comes with an integrated Prometheus deployment that automatically collects metrics for each tunnel.
Note
Prometheus is deployed with Inlets Uplink by default. If you don't need monitoring you can disable it in the values.yaml of the Inlets Uplink Helm chart:
prometheus:
  create: false
You can explore the inlets data using Prometheus's built-in expression browser. To access it, port forward the prometheus service and than navigate to http://localhost:9090/graph
kubectl port-forward \
  -n inlets \
  svc/prometheus 9090:9090
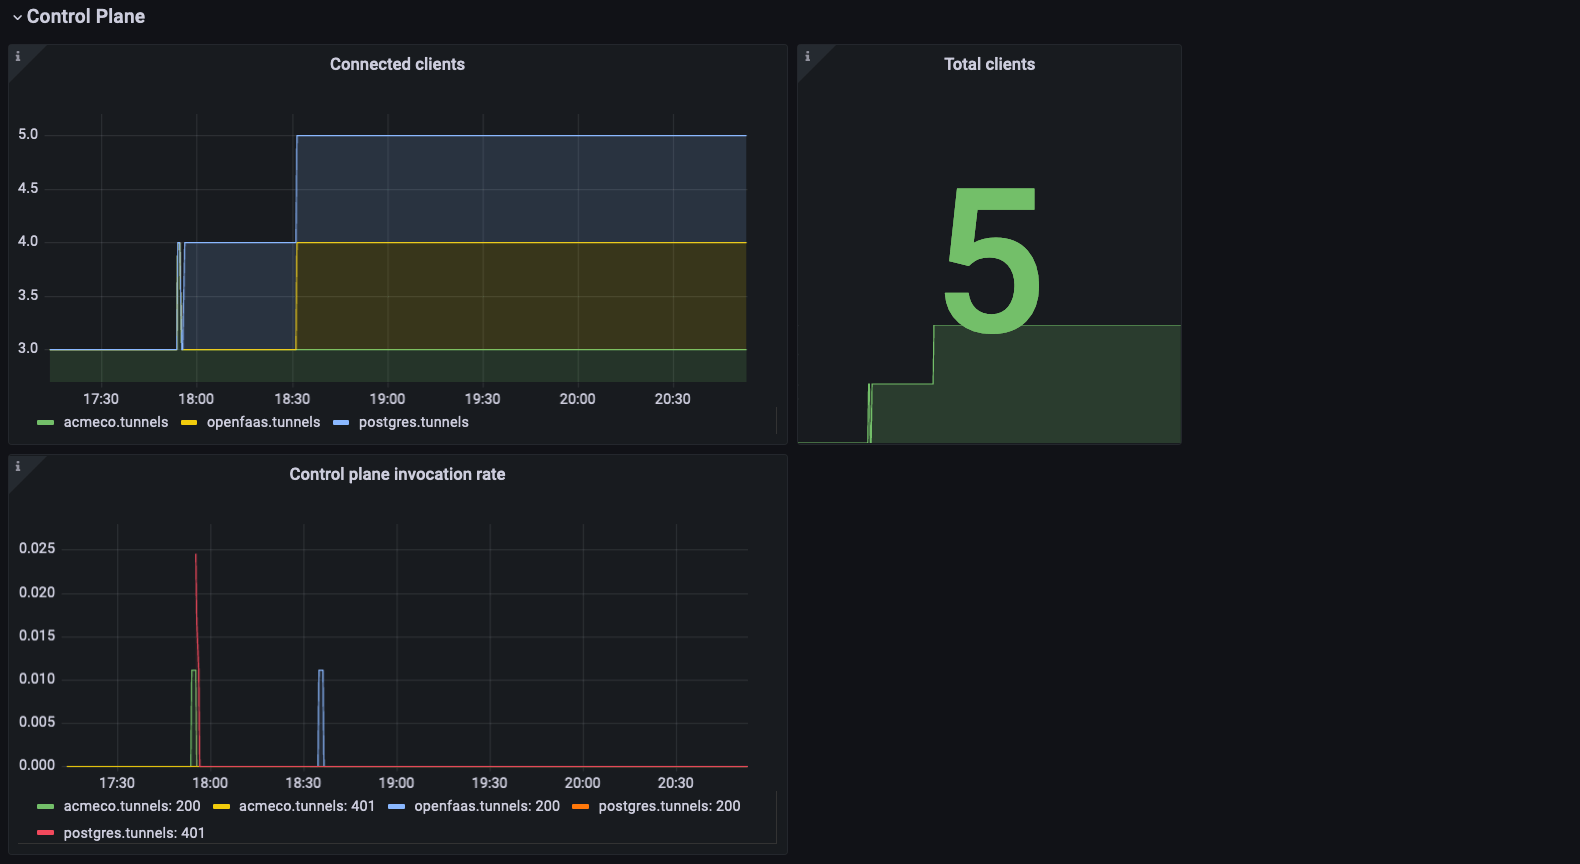
Metrics for the control-plane
The control-plane metrics can give you insights into the number of clients that are connected and the number of http requests made to the control-plane endpoint for each tunnel.
| Metric | Type | Description | Labels |
|---|---|---|---|
| controlplane_connected_gauge | gauge | gauge of inlets clients connected to the control plane | tunnel_name |
| controlplane_requests_total | counter | total HTTP requests processed by connecting clients on the control plane | code, tunnel_name |
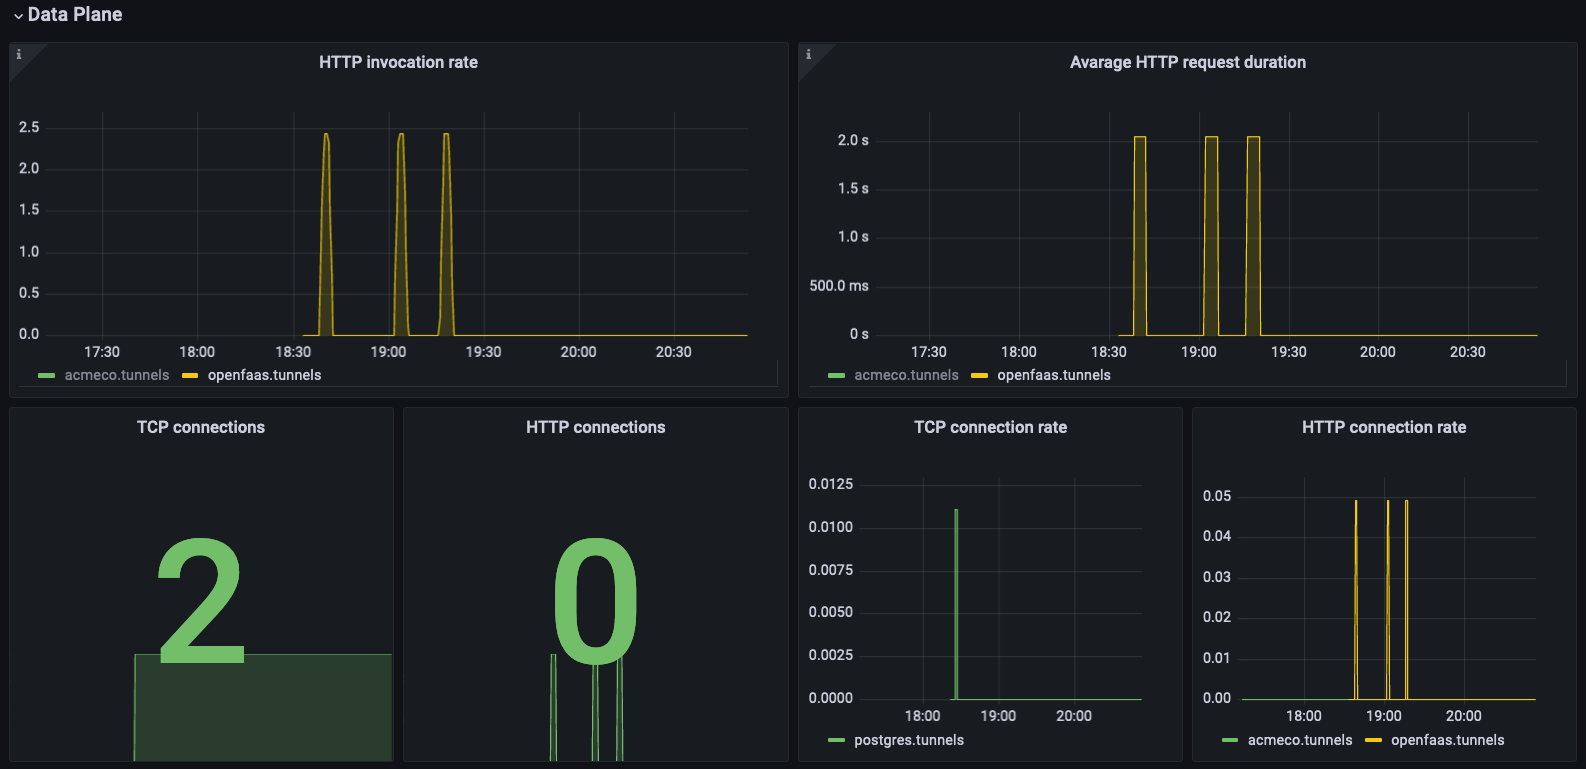
Metrics for the data-plane
The data-plane metrics can give you insights in the services that are exposed through your tunnel.
| Metric | Type | Description | Labels |
|---|---|---|---|
| dataplane_connections_gauge | gauge | gauge of connections established over data plane | port, type, tunnel_name |
| dataplane_connections_total | counter | total count of connections established over data plane | port, type, tunnel_name |
| dataplane_requests_total | counter | total HTTP requests processed | code, host, method, tunnel_name |
| dataplane_request_duration_seconds | histogram | seconds spent serving HTTP requests | code, host, method, tunnel_name, |
The connections metrics show the number of connections that are open at this point in time, and on which ports. The type label indicates whether the connection is for a http or tcp upstream.
The request metrics only include HTTP upstreams. These metrics can be used to get Rate, Error, Duration (RED) information for any API or website that is connected through the tunnel.
Setup Grafana for monitoring
Grafana can be used to visualize the data collected by the inlets uplink Prometheus instance. We provide a sample dashboard that you can use as a starting point.
Inlets uplink Grafana dashboard
The dashboard can help you get insights in:
- The number of client connected to each tunnel.
- Invocation to the control plane for each tunnel. This can help with detecting misbehaving clients.
- Rate, Error, Duration (RED) information for HTTP tunnels.
- The number of connections TCP connections opened for each tunnel.
Install Grafana
There are three options we recommend for getting access to Grafana.
- Grafana installed with its Helm chart
- Grafana Cloud
- AWS managed Grafana
You can install Grafana in one line with arkade:
arkade install grafana
Port forward grafana and retrieve the admin password to login:
# Expose the service via port-forward:
kubectl --namespace grafana port-forward service/grafana 3000:80

# Get the admin password:
kubectl get secret --namespace grafana grafana -o jsonpath="{.data.admin-password}" | base64 --decode ; echo
Access Grafana on http://127.0.0.1:3000 and login as admin.
Add a data source
Before you import the dashboard, you need to add the inlets-uplink prometheus instance as a data source:
- Select the cog icon on the side menu to show the configuration options.
-
Select Data sources.
This opens the data sources page, which displays a list of previously configured data sources for the Grafana instance.
-
Select Add data source and pick Prometheus from the list of supported data sources.
-
Configure the inlets Prometheus instance as a data source:
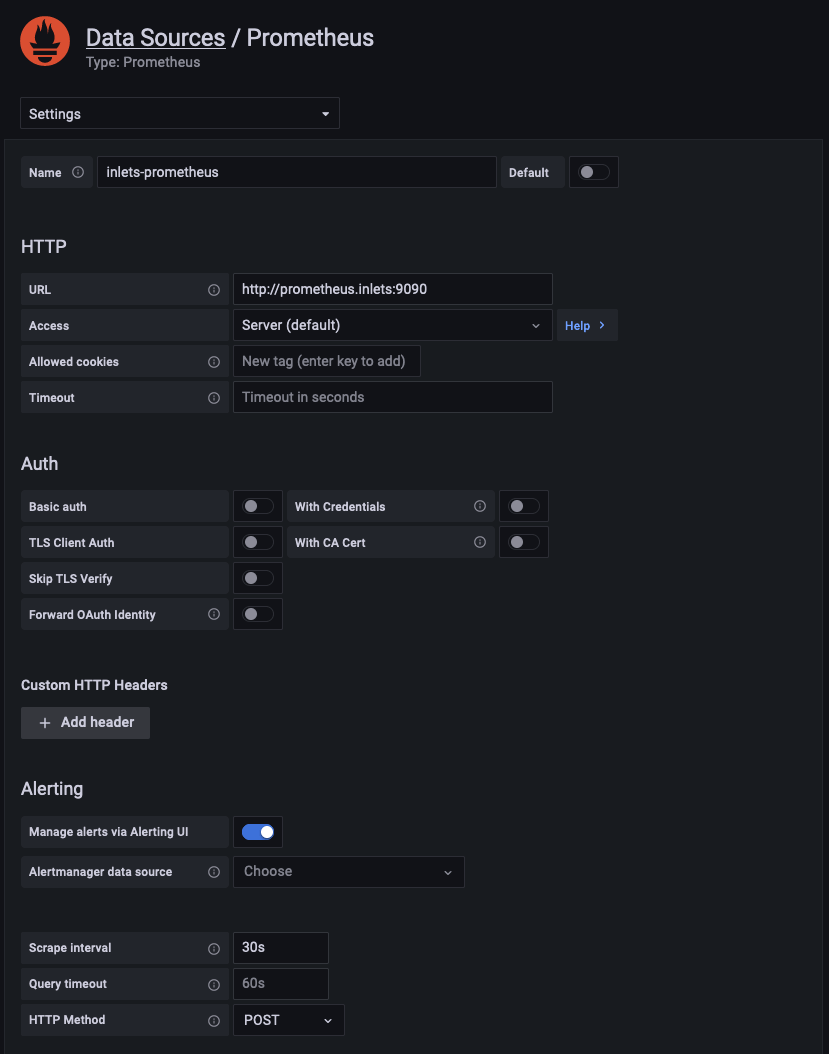
- In the name field set:
inlets-prometheus - For the URL use:
http://prometheus.inlets:9090if you installed inlets uplink in a different namespace this url should be
http://prometheus.<namespace>:9090 - Set the scrape interval field to
30s
- In the name field set:
Import the dashboard
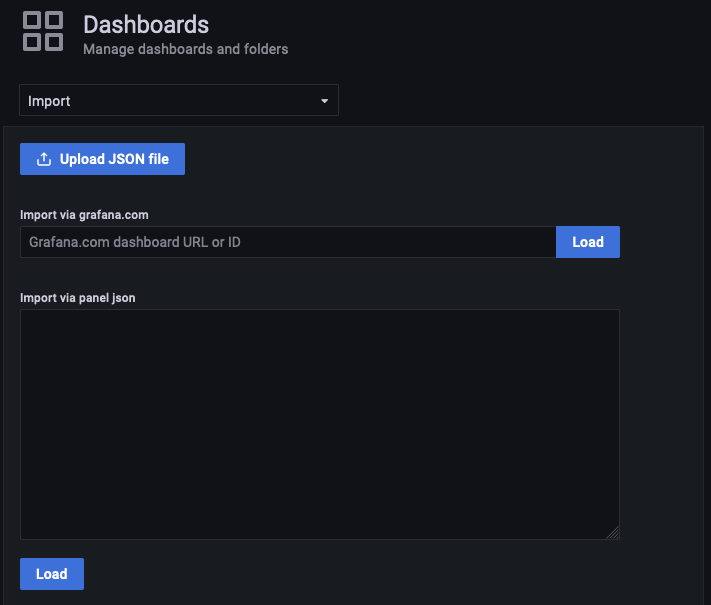
Import the inlets uplink dashboard in Grafana:
- Click Dashboards > Import in the side menu.
- Copy the dashboard JSON text
-
Paste the dashboard JSON into the text area.